Solar2You is a system of monitoring easy to use, effective and complete, that allows you to monitor the performance and operational status of one or more photovoltaic plants
Strengths
Exhaustive and real time monitoring from one or more photovoltaic plants by means of a dedicated web interface
Detailed analysis of historical data by appropriate reporting
Evolved analysis of the performance thanks to Area Values
Professional and reliable datalogger
Multi-brand compatibility
Also suitable for monitoring energy consumption, environmental parameters. Suitable for integration with industrial control systems and automation
Highly qualified technical support
Ideal solution for

Owners of Photovoltaic Plants

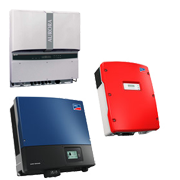
Installers and Maintainers of Photovoltaic Plants

Energy Manager

Experts in Energy Management (EGE)

Energy Service Company

Plant Field

By this view, the maintainer can occur in a single glance the operating status of all monitored systems, detecting, for each plant, the presence of any alarm and the production differences with respect to the project estimates. The section, customizable with your logo, allows searching and sorting of the plant field according to various criteria such as: power plant, energy produced in the day or month, etc.

Plant Scheme

The various devices (inverters, string box, counters,...) are shown in an overview, in technical diagram of the single plant, which is available in the Real Time section. The scheme also allows to detect the presence of any critical issues on the monitored devices and access to data detail and to daily measurements of a single device for the detection and analysis of the problem.

Real Time

The Real Time section gives you the possibility to check in real time the proper functioning of the plant and to analyze the performance of each component of the system: inverters, strings, energy meters, environmental sensors. The status indicators and measures relating to the last update received data and some graphics about the performance of the system are shown. In the presence of faults, the system automatically generates alarms that can be sent via e-mail/SMS to the owner and maintainer of the system for a possible early intervention.

Historical Data

A series of reports allow you to use the data stored by the system over the time to make detailed analysis relating to the progress of the individual plant. For example, you can view: the produced energy and compare it with the production estimates, the energy produced for each inverter, the revenues relating to the account energy incentive, the avoided CO2, the trend of the power, etc. Historical data can be viewed in both graphical and tabular form, with different kinds of detail: annual, monthly, daily and hourly summary. The obtained reports can be also exported to various formats (Excel, CSV).

Case History: Network Noise

  • Thanks to the resources it has been found that, in a photovoltaic plant, changes in voltage over the threshold caused temporary shutdowns of inverters, preventing the energy produced by the plant to be entered into the electrical network (power curve and the blue curve of voltage in red). This resulted in a substantial loss of efficiency and thus money.
  • The detailed analysis carried out by means of resources has allowed to identify the cause of the problem and, consequently, to report the malfunction to the distributor, attaching the relevant documents. As a result of the interventions on the network by the local distributor, the plant is back to being fully functional and efficient.

Datalogger S2Y

Low power consumption Industrial Embedded Computer, suitable to operate in both industrial and domestic environments. Available with Ethernet and GPRS (integrated modem) interfaces, it can be installed on DIN rail in control cabinets. It interfaces to various devices through the RS485 and RS232 communication ports.

Innovative Aspects: Area Values

The maintainer can compare, in periods of observation such as "previous day", "current month" and "previous month", the performance of a system with those of other plants present in the same area (Area Values). Through these indicators, based on a sophisticated system of calculation, you can then verify the quality of operation of the single plant without knowing the environmental conditions of the place in which it is located (irradiance, cell temperature, ambient temperature). The more populated is the area in the reference sample, the more significant will be the relating area values.
Scientific publication presented at 2013 AIGE conference.

Solar2View

Solar2View results from the integration of the S2Y system with the various available video media (LCD, LED billboards, etc.). An ideal solution for public administrations and private wishing to give greater visibility to the results obtained from the made investment, eventually also by integrating alerts, images and advertisements into the main information system. The information is also accessible on Android devices (smartphones, tablets, miniProfile, etc.) by innovatibe APPS.

Plant Field

By this view, the maintainer can occur in a single glance the operating status of all monitored systems, detecting, for each plant, the presence of any alarm and the production differences with respect to the project estimates. The section, customizable with your logo, allows searching and sorting of the plant field according to various criteria such as: power plant, energy produced in the day or month, etc.

Plant Scheme

The various devices (inverters, string box, counters,...) are shown in an overview, in technical diagram of the single plant, which is available in the Real Time section. The scheme also allows to detect the presence of any critical issues on the monitored devices and access to data detail and to daily measurements of a single device for the detection and analysis of the problem.

Real Time

The Real Time section gives you the possibility to check in real time the proper functioning of the plant and to analyze the performance of each component of the system: inverters, strings, energy meters, environmental sensors. The status indicators and measures relating to the last update received data and some graphics about the performance of the system are shown. In the presence of faults, the system automatically generates alarms that can be sent via e-mail/SMS to the owner and maintainer of the system for a possible early intervention.

Historical Data

A series of reports allow you to use the data stored by the system over the time to make detailed analysis relating to the progress of the individual plant. For example, you can view: the produced energy and compare it with the production estimates, the energy produced for each inverter, the revenues relating to the account energy incentive, the avoided CO2, the trend of the power, etc. Historical data can be viewed in both graphical and tabular form, with different kinds of detail: annual, monthly, daily and hourly summary. The obtained reports can be also exported to various formats (Excel, CSV).

Case History: Network Noise

Thanks to the resources it has been found that, in a photovoltaic plant, changes in voltage over the threshold caused temporary shutdowns of inverters, preventing the energy produced by the plant to be entered into the electrical network (power curve and the blue curve of voltage in red). This resulted in a substantial loss of efficiency and thus money.
The detailed analysis carried out by means of resources has allowed to identify the cause of the problem and, consequently, to report the malfunction to the distributor, attaching the relevant documents. As a result of the interventions on the network by the local distributor, the plant is back to being fully functional and efficient.

Datalogger S2Y

Low power consumption Industrial Embedded Computer, suitable to operate in both industrial and domestic environments. Available with Ethernet and GPRS (integrated modem) interfaces, it can be installed on DIN rail in control cabinets. It interfaces to various devices through the RS485 and RS232 communication ports.

Innovative Aspects: Area Values

The maintainer can compare, in periods of observation such as "previous day", "current month" and "previous month", the performance of a system with those of other plants present in the same area (Area Values). Through these indicators, based on a sophisticated system of calculation, you can then verify the quality of operation of the single plant without knowing the environmental conditions of the place in which it is located (irradiance, cell temperature, ambient temperature). The more populated is the area in the reference sample, the more significant will be the relating area values.
Scientific publication presented at 2013 AIGE conference.

Solar2View

Solar2View results from the integration of the S2Y system with the various available video media (LCD, LED billboards, etc.). An ideal solution for public administrations and private wishing to give greater visibility to the results obtained from the made investment, eventually also by integrating alerts, images and advertisements into the main information system. The information is also accessible on Android devices (smartphones, tablets, miniProfile, etc.) by innovatibe APPS.

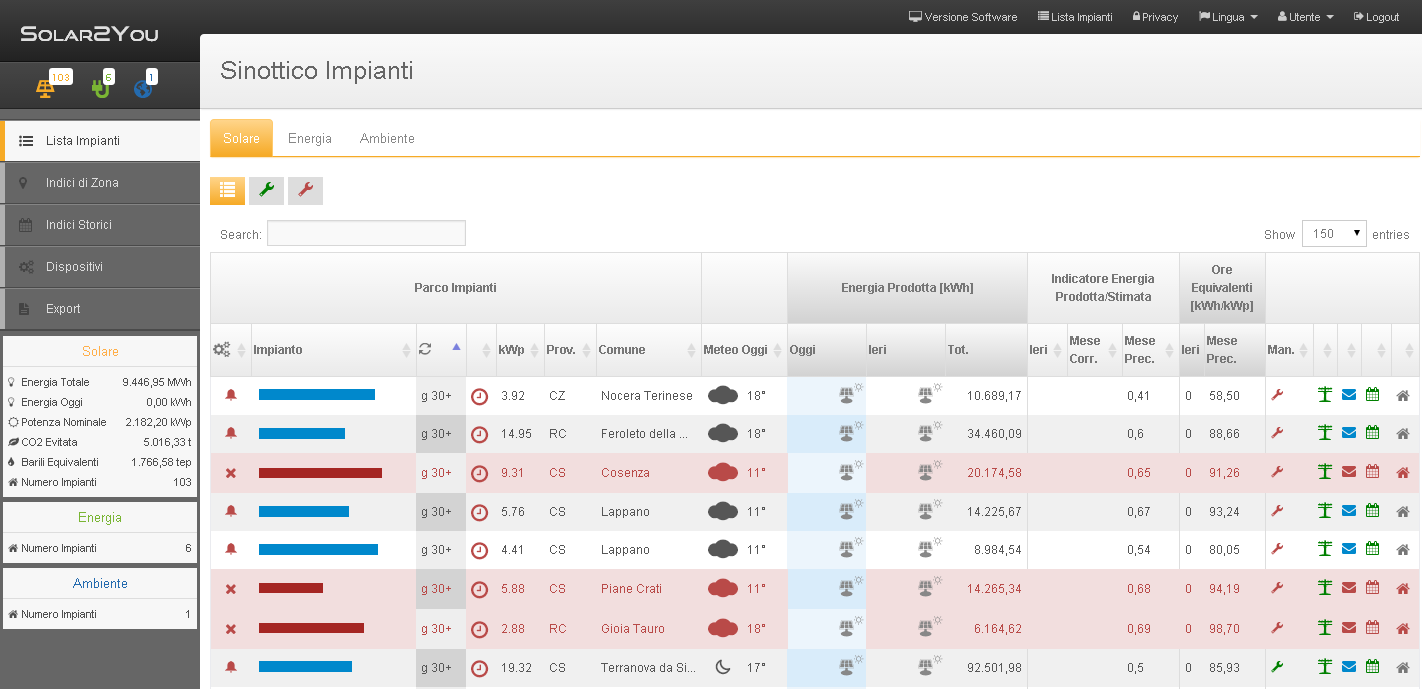
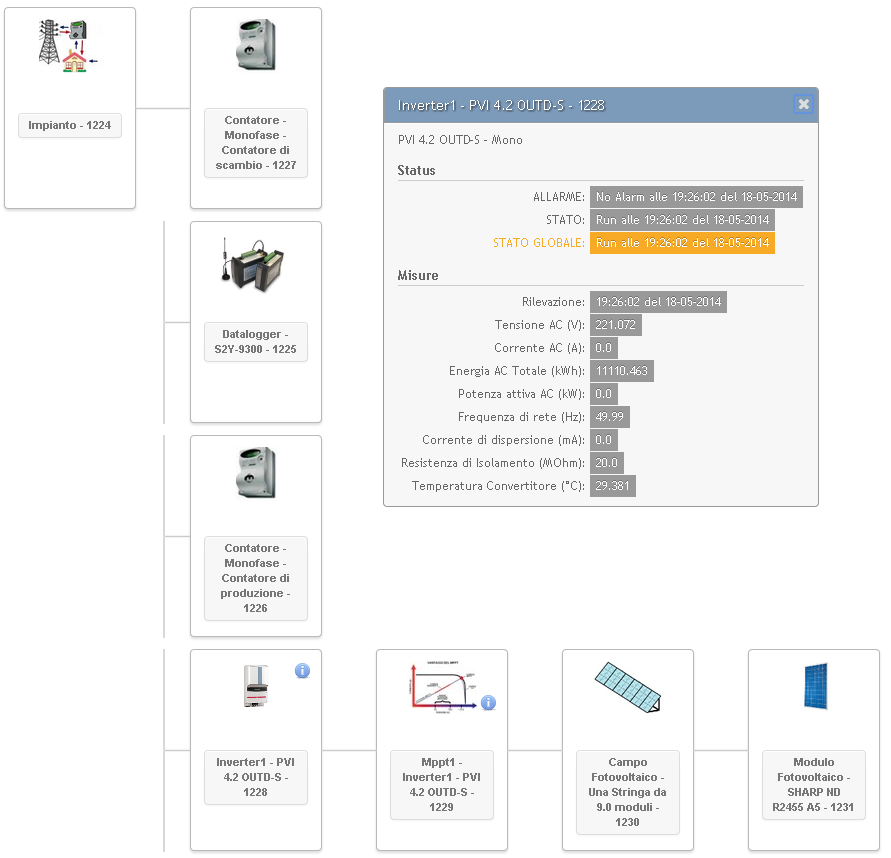
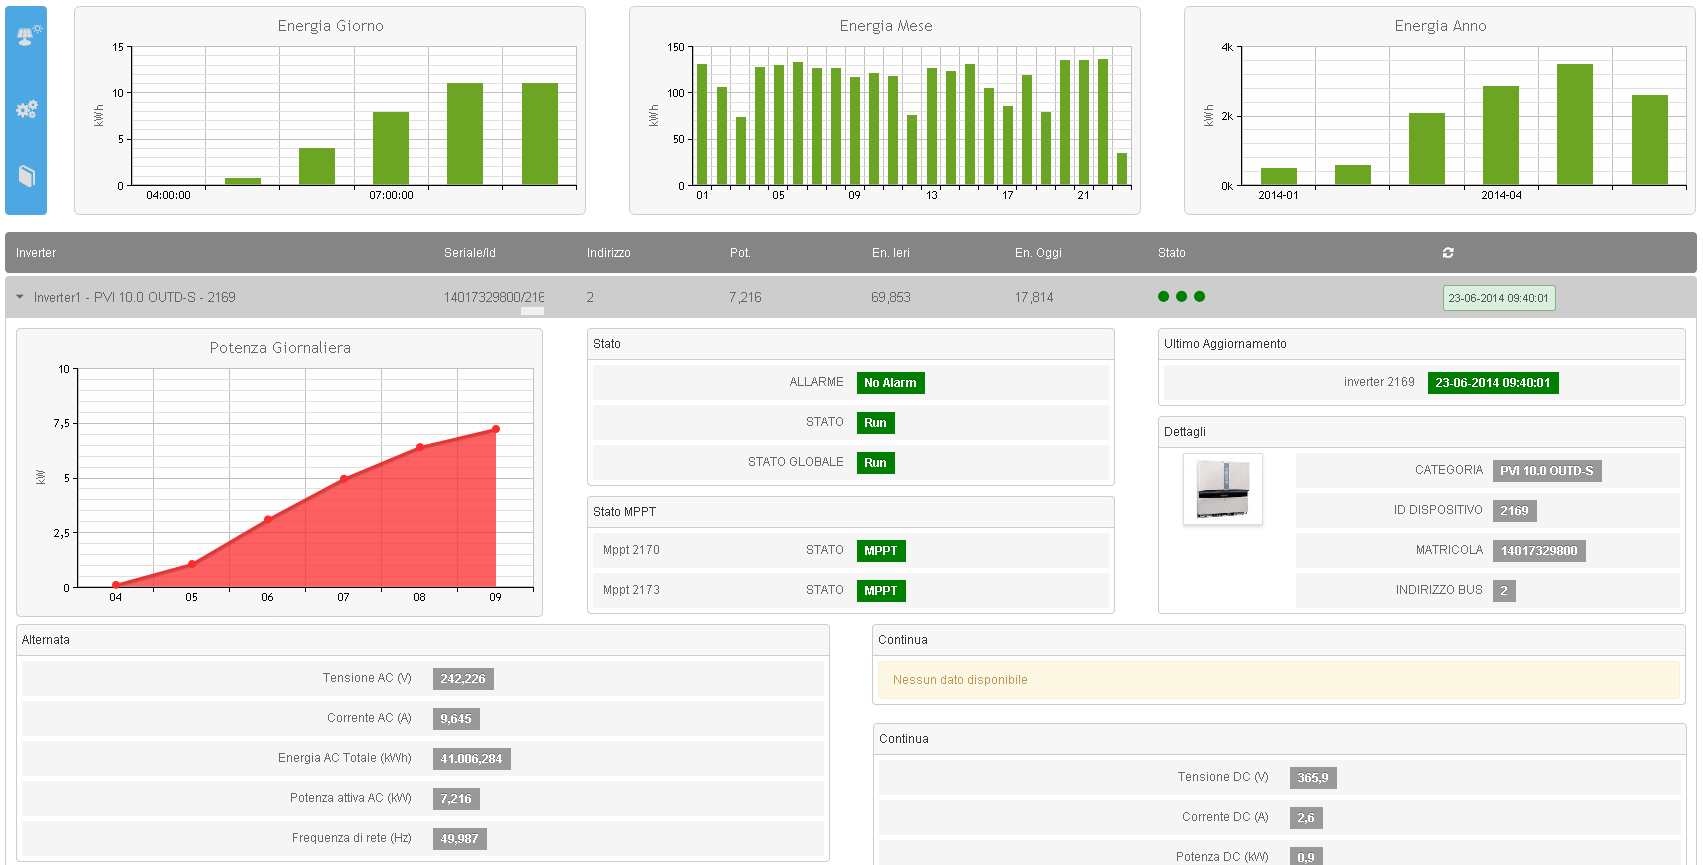
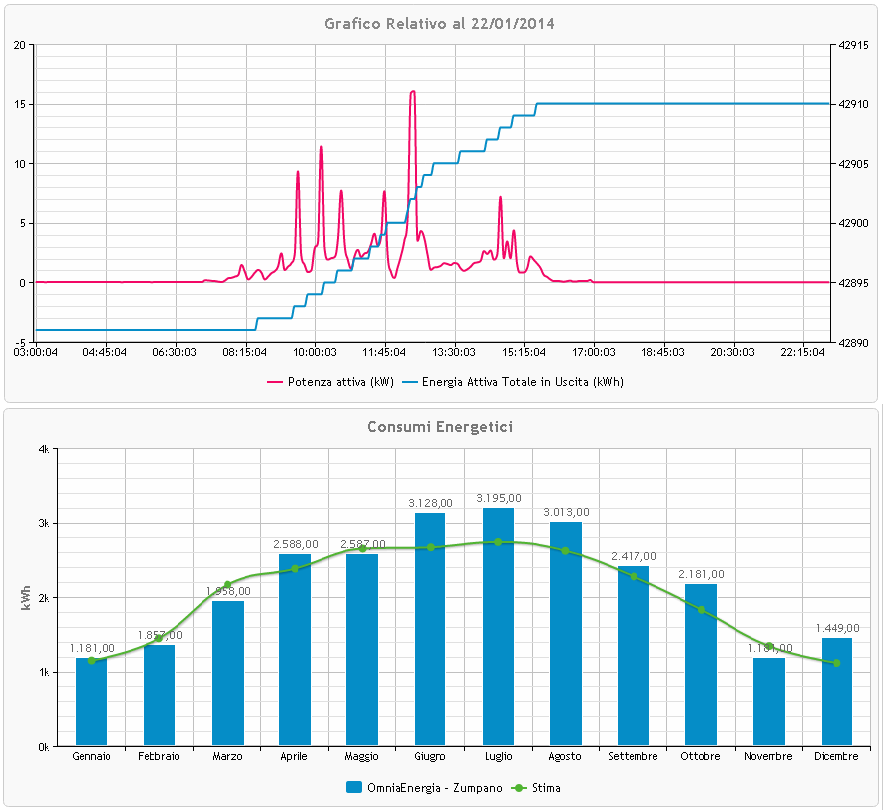
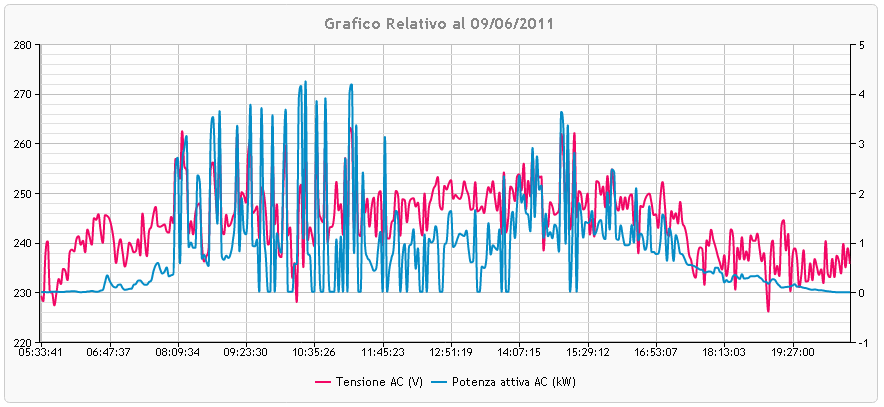
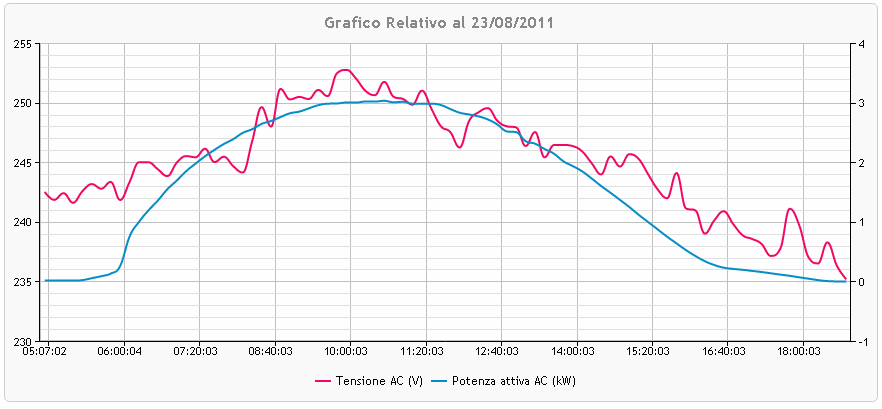
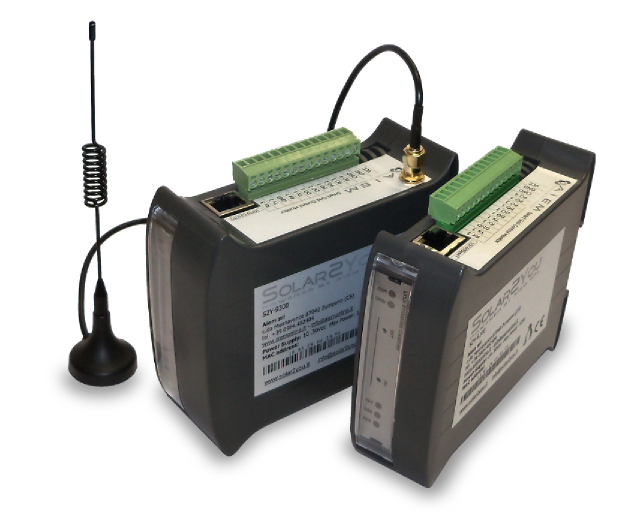
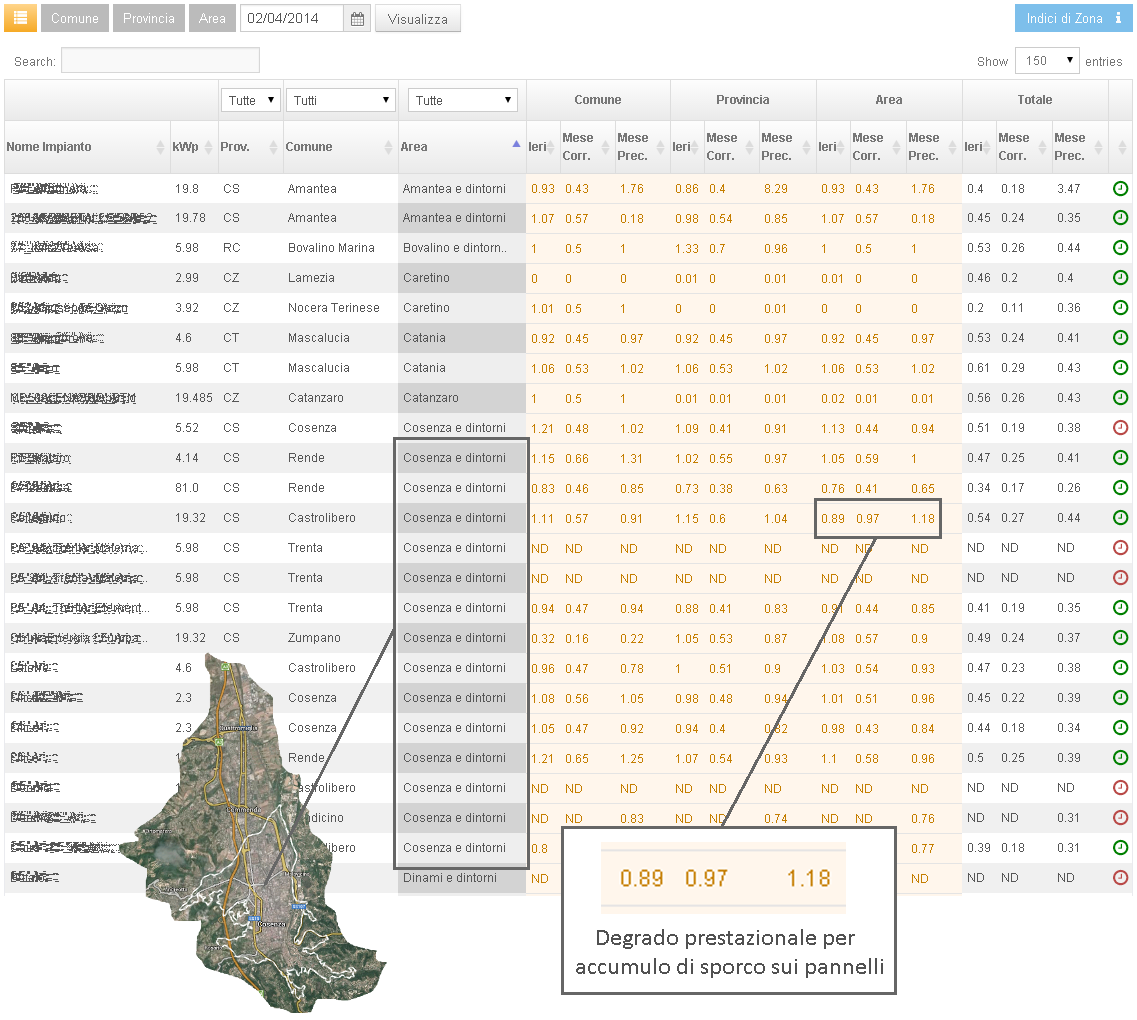
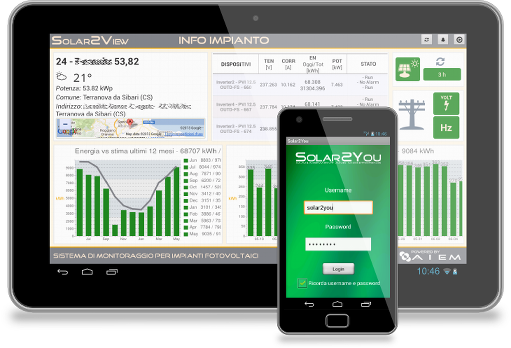
Ener2You system for monitoring and analysis of energy consumption and quality of the electrical network for a rational energy management

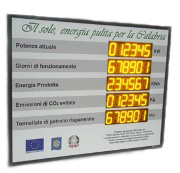
Monitoring with the certification of the measurement taken from environmental sensors (irradiance, ambient temperature, solar panel, humidity, wind, ...)

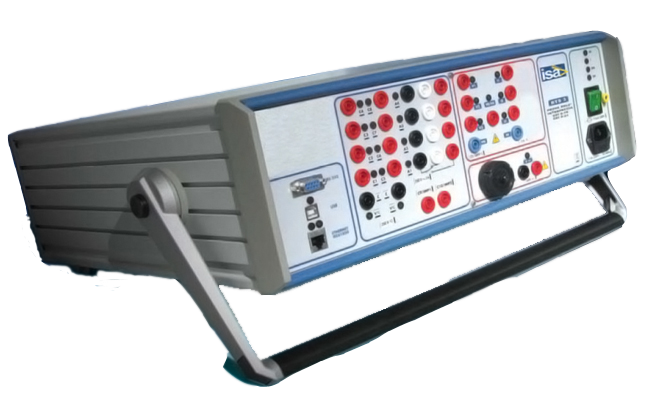
Custom solutions for the automation of the company processes in any industry (scada, plc, rs485 bus, home automation, remote control, drives, ..)

Download Area
Demo